Chapter 4 Results
4.1 Relationship between movie length and rating
We start by plotting the following frequency histogram to see the distribution of the data, we observe that
- We would expect that a standard movies have length around 90 to 120 minutes, but the plot shows a lot of outliers
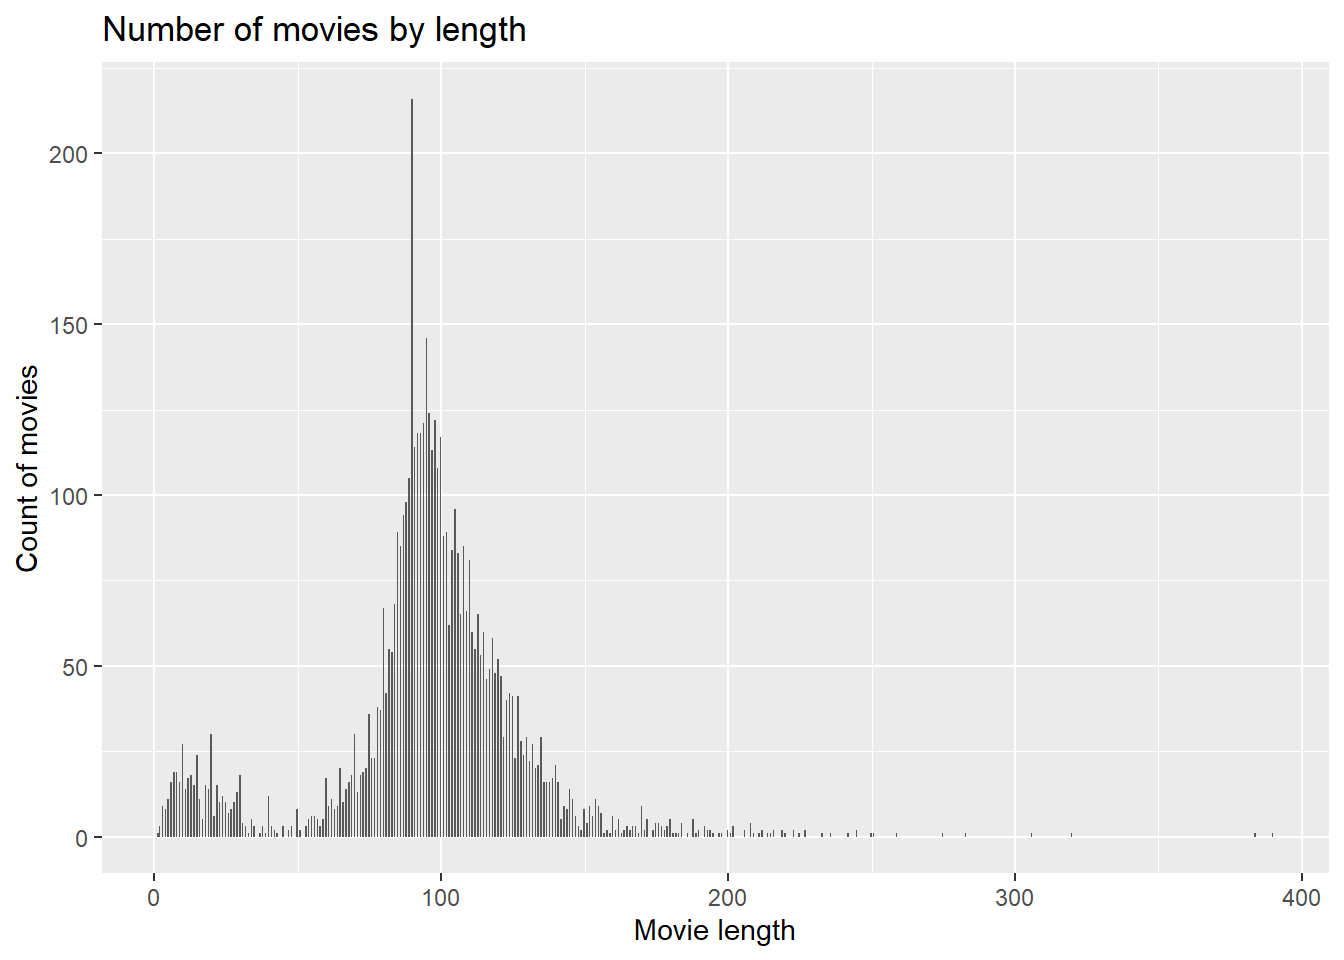
We decide to remove the those outliers (those outside fences).
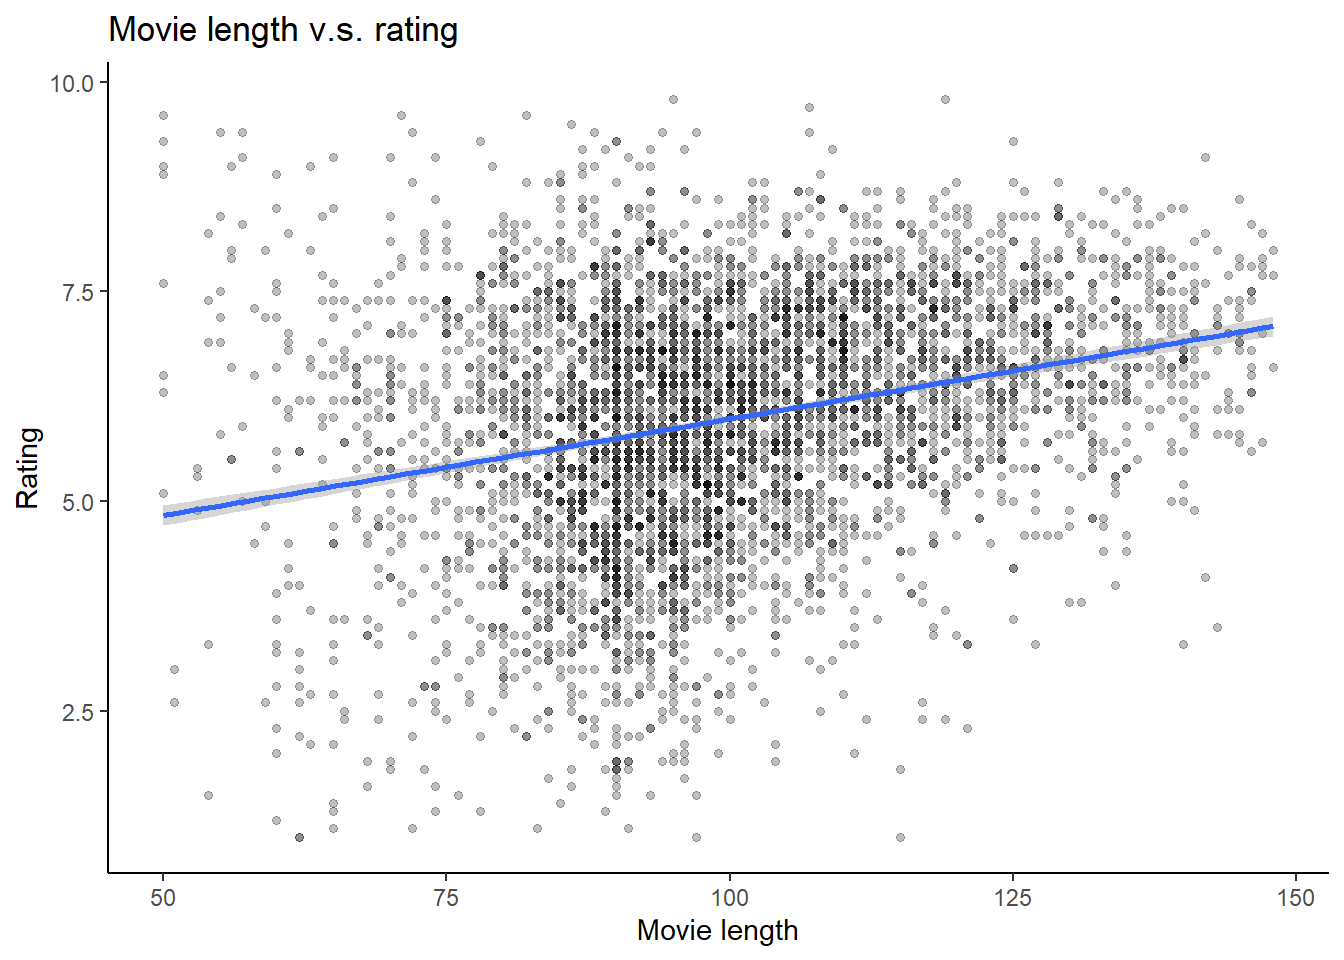
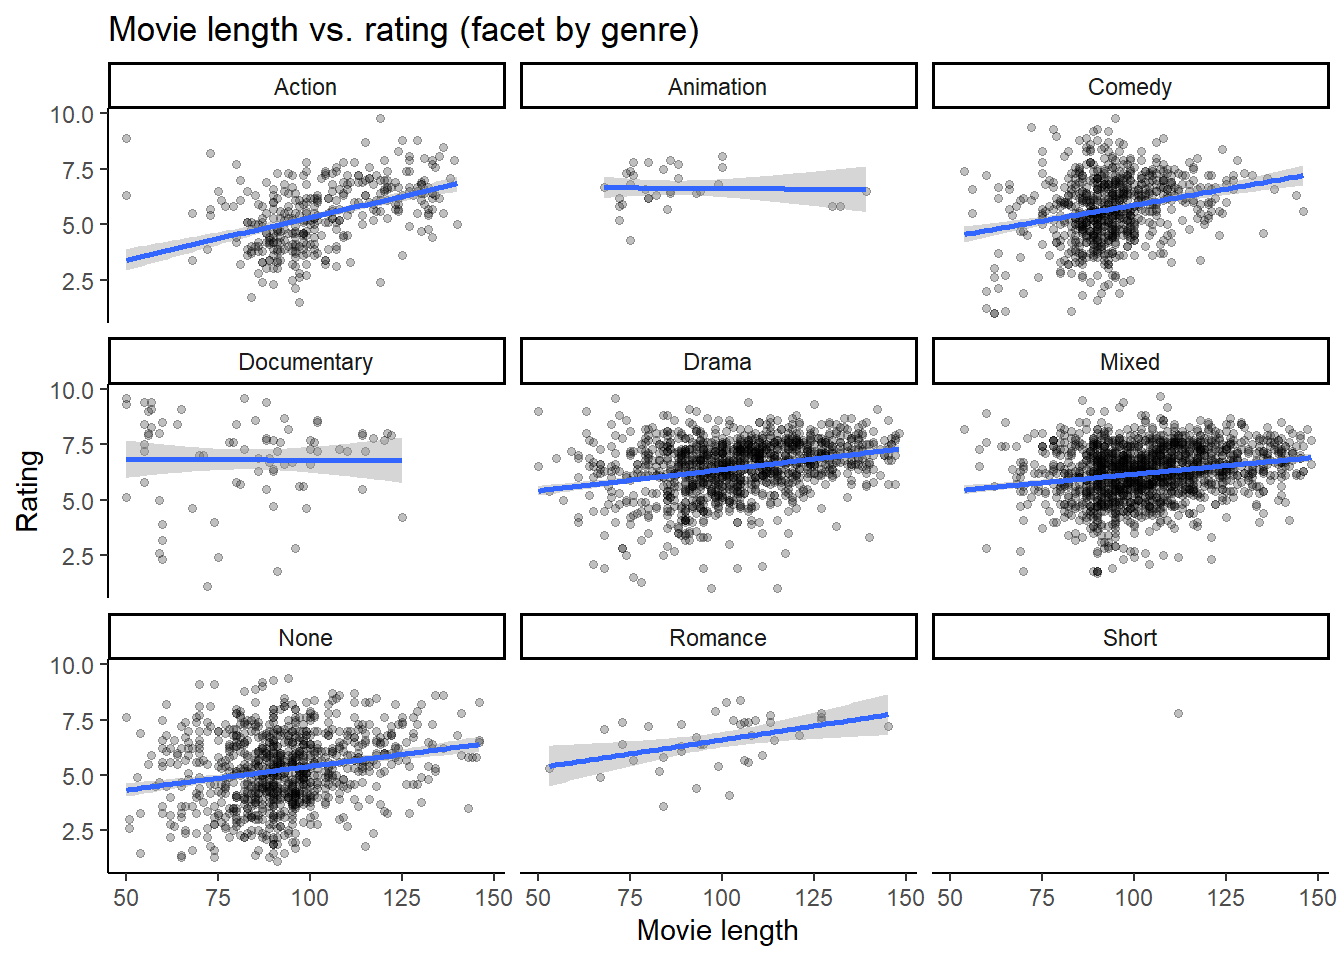
From the scatter plot, we can observe that there’s a positive correlation between movie length and rating
- Movies with length around 50 to 75 minutes have ratings all over the place
- Movies with length longer than 125 minutes have higher ratings in general
- Movies with exceptionally high ratings (> 8) have all kinds of length
Same conclusion can be drawn if we facet by movie genre
- There seems to be a positive relationship between movie length and ratings (especially for “Action”, “Comedy”, “Drama”)
- Documentary and Animation does not show positive correlation
4.2 Relationship between movie release time and rating
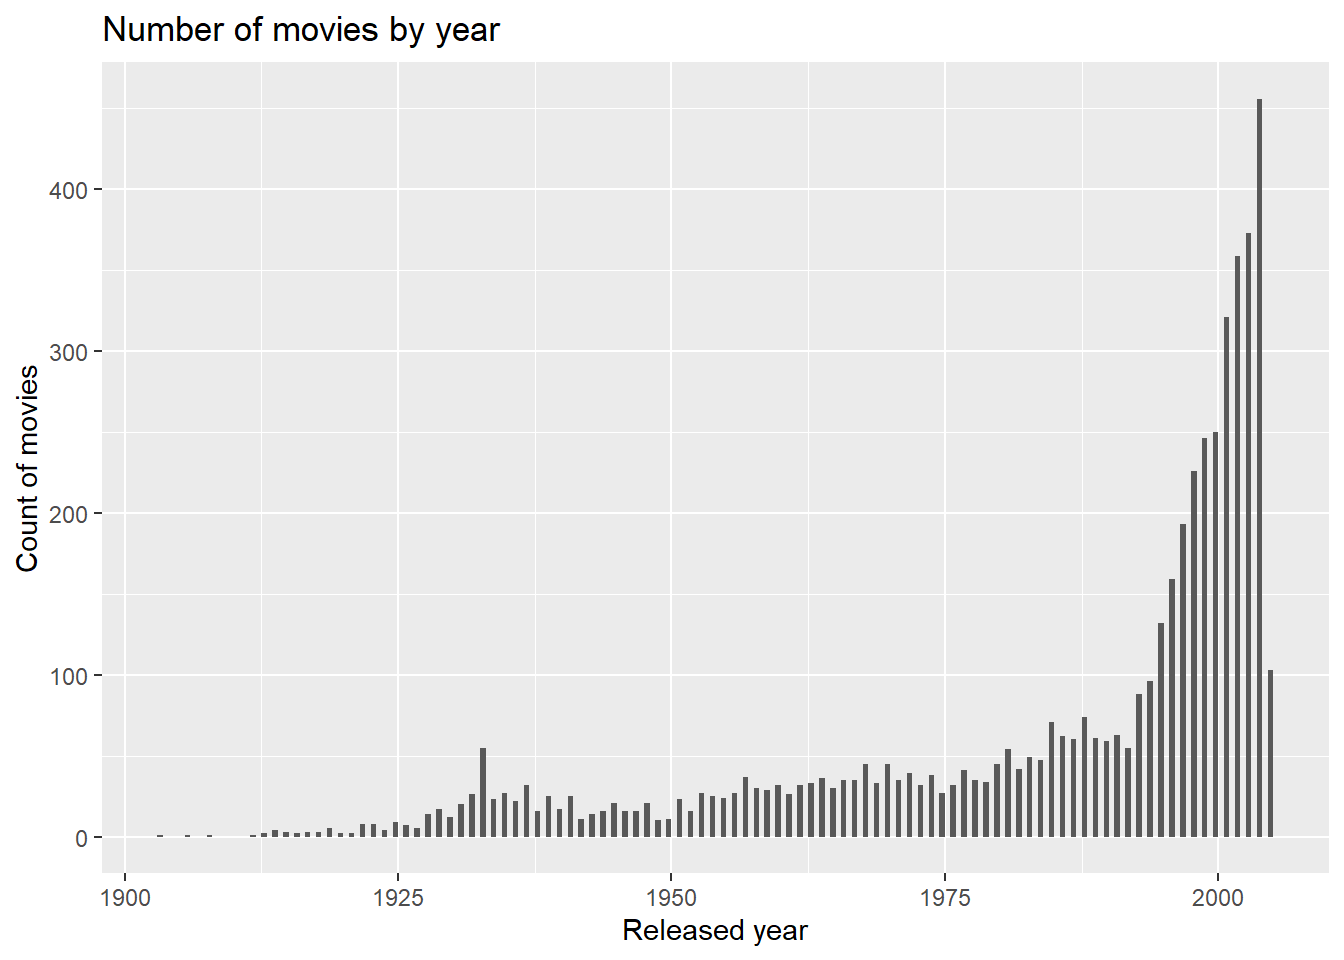
We start by plotting the following frequency histograms to see the distribution of the data, we observe that
- The distribution of movies by year is left-skewed (most of the movies in the dataset is released after 1990)
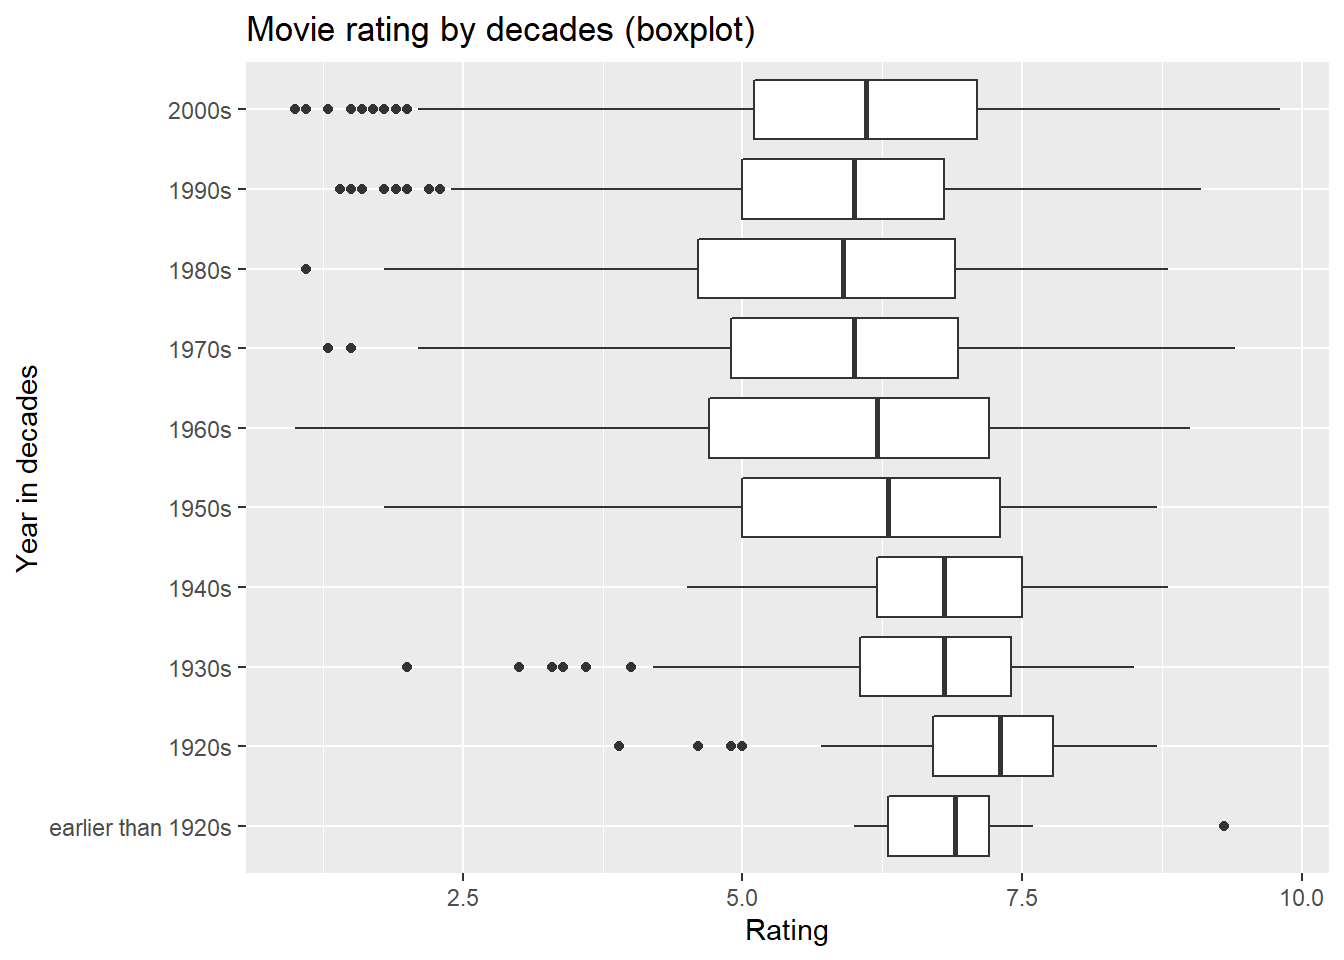
To inspect the relationship between ratings and release year, we decide to first round year into decade (e.g., 1990s means any year from 1990 to 1999), we can observe from the boxplot that movies released earlier than 1950s seems to have higher median rating than more recent movies. But recent movies have larger spread than earlier movies with respect to reatings.
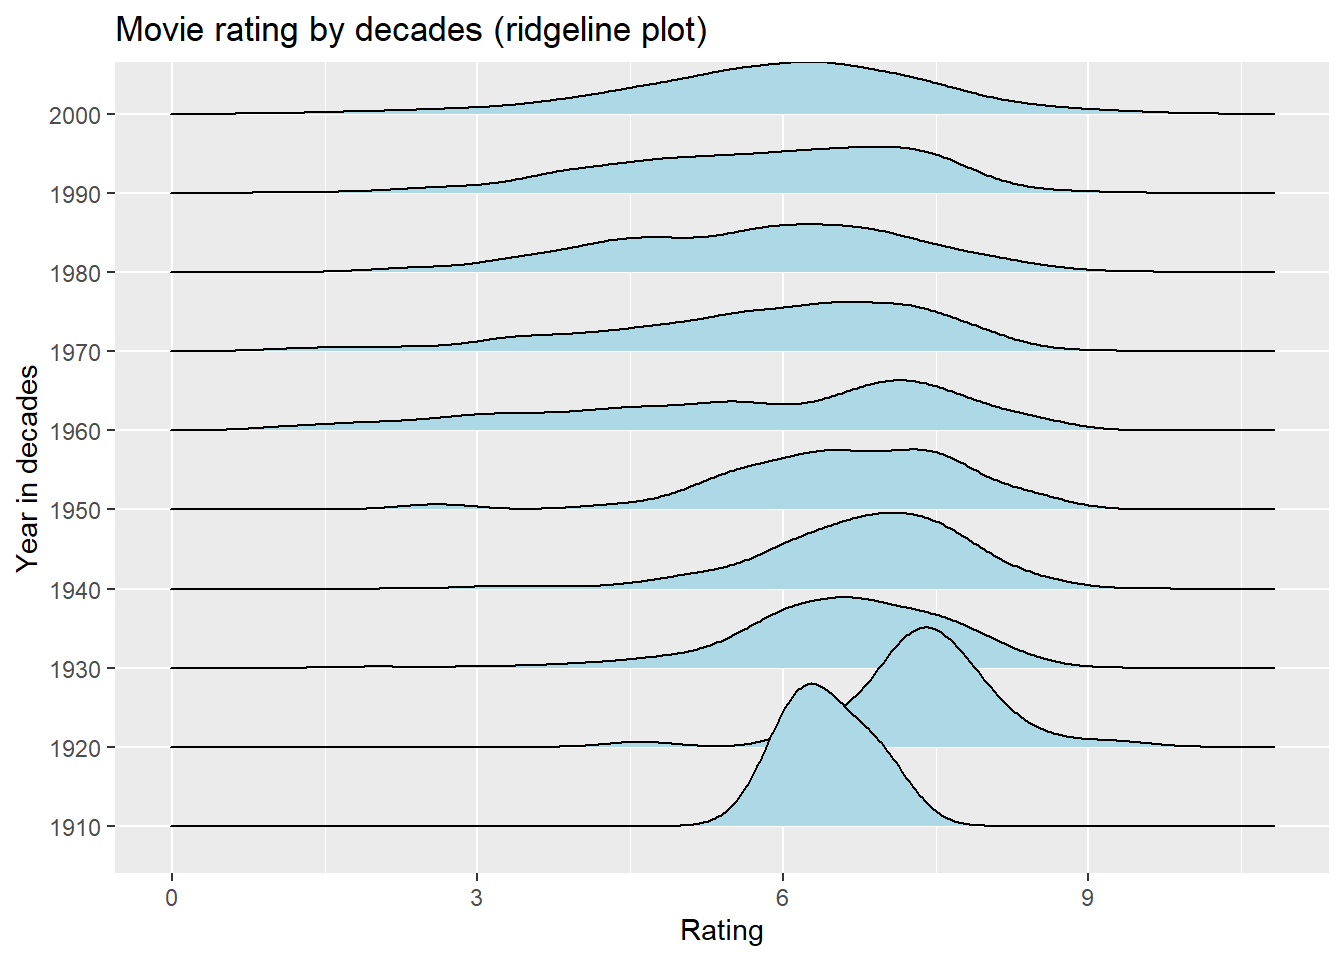
Same conclusion can be drawn from the ridgeline plot.
4.3 Relationship between movie genre and rating
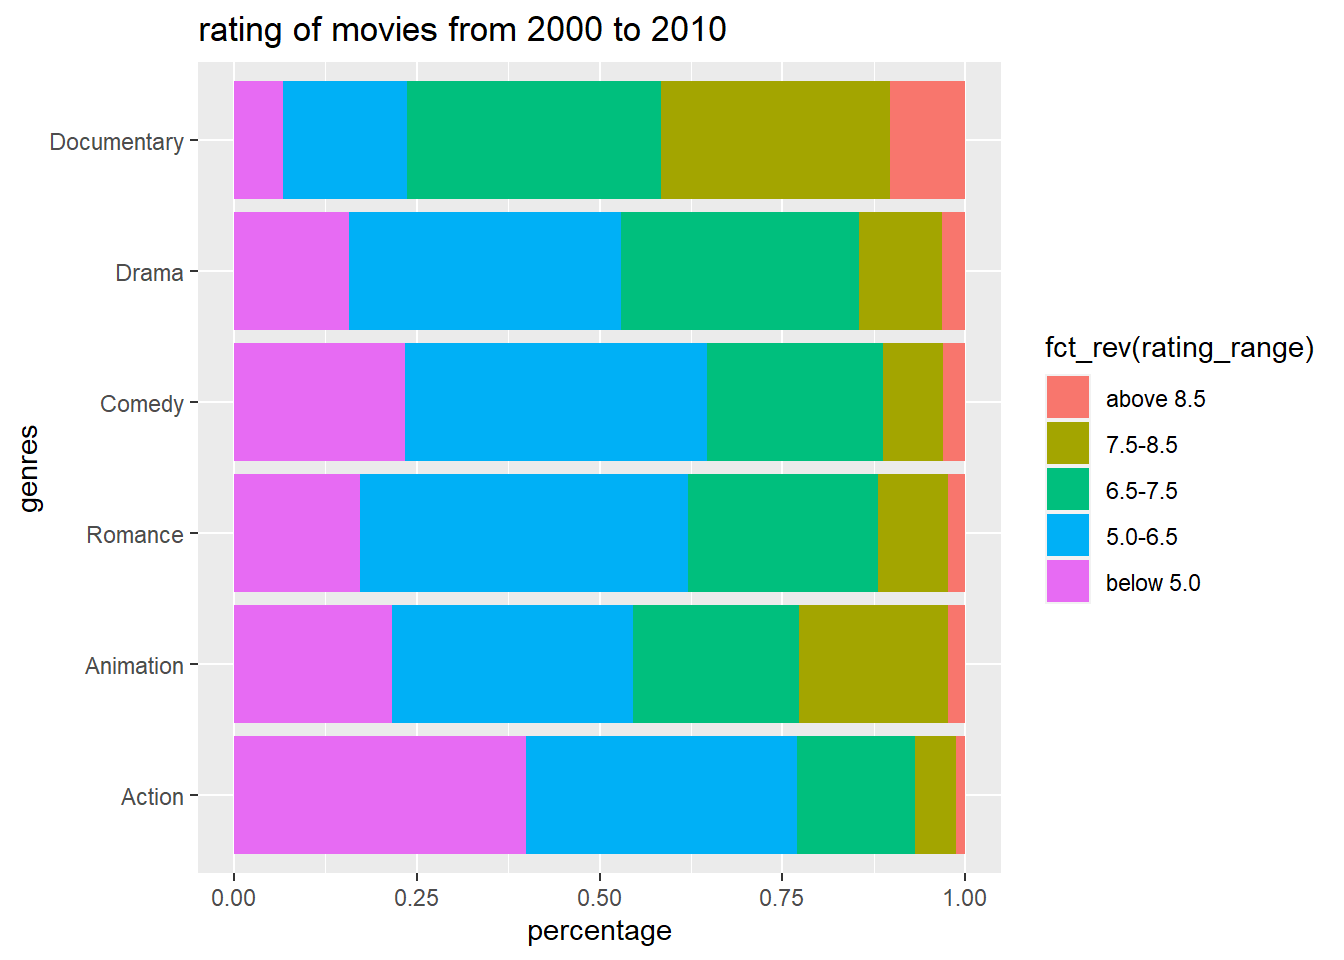
To reduce the impact of other factor, we mainly focus on the standard movies that have length between 90 to 120 minutes and were released between 2000 and 2010.
We order the genres in decreasing order of high rating (above 8.5 points) percentage from top to bottom. We can observe that over 10 percent Documentary movies obtained ratings above 8.5 out of 10, which is a high proportion comparing to other genres. Also, it is obvious that only a small percentage of Documentary movies obtained low rating (below 5 points). By contrast, nearly 40% of Action Movies get low ratings(below 5 points), and they had lowest percentage on high ratings.
To know that the ratings and the movie genres are not independent, we can have a Chi-squared test on the data.
The null hypothesis: The ratings and the movie genres are not independent, which means there is no relationship between them.
The Chi-squared test gives a really small p-value, so it is almost impossible to obtain the data given the null hypothesis is true. Thus, we’d like to reject the null hypothesis and say that the ratings and the movie genres are correlated.
##
## Pearson's Chi-squared test
##
## data: df_percent_ma
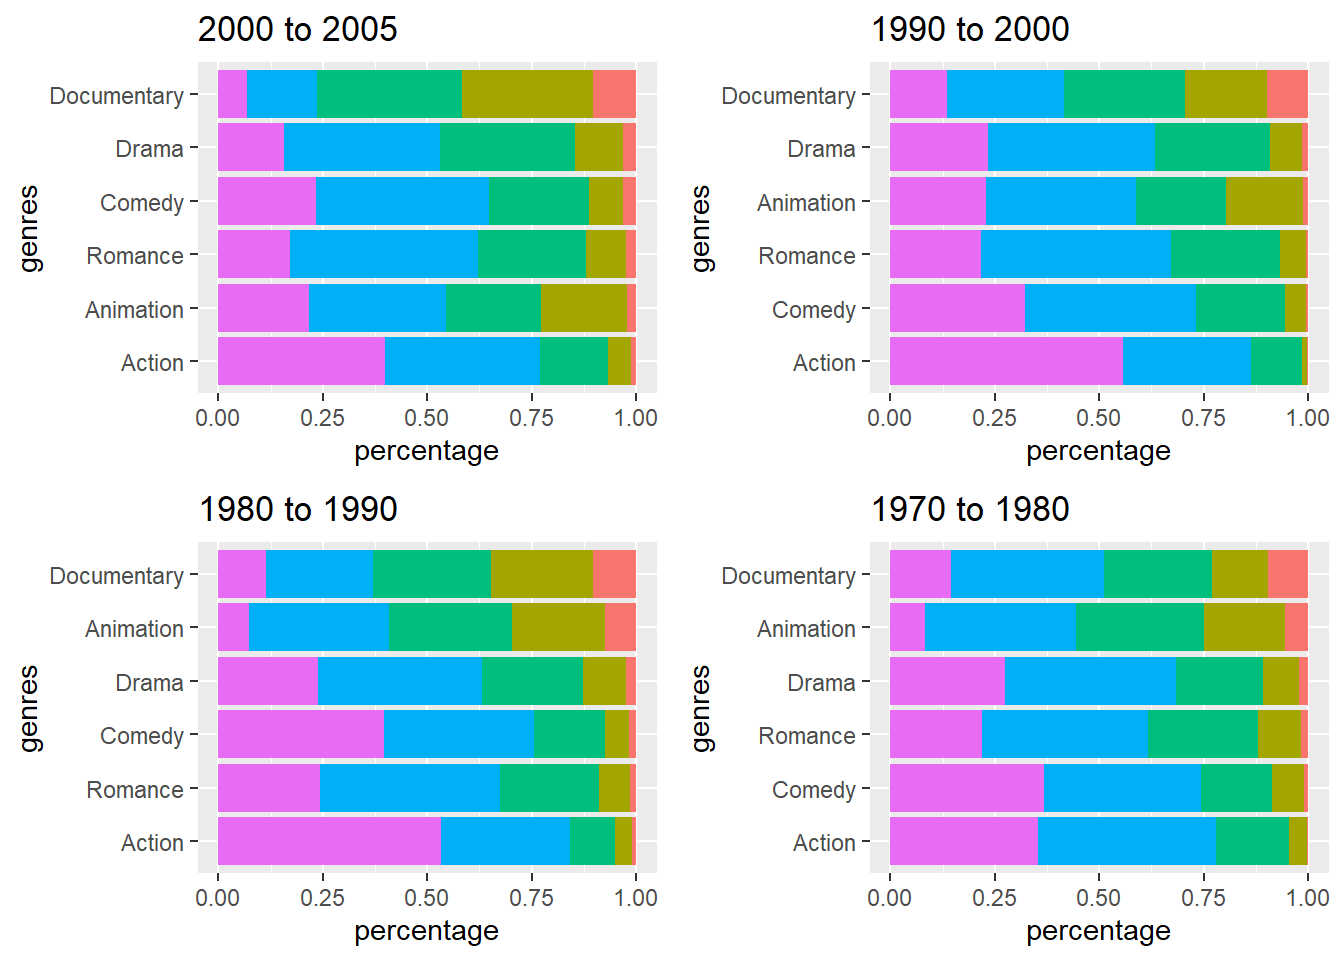
## X-squared = 761.63, df = 20, p-value < 2.2e-16Now, we can plot bar charts by decades, and we can observe similar patterns as above. The documentary movies always have relatively higher ratings, and the actions movies always have relatively worse performance on ratings.
These findings are consistent with our expectations. We guessed that documentary movies may be easier to obtain a high rating, because audiences would easily resonate with this type of film which is more related to their real life, and audiences will be more tolerant of the visuals of documentary movies. However, many action movies are commercial films, which always have similar plot and mode. Thus the audience may be more likely to get bored and have higher requirements for special effects to give a high rating.
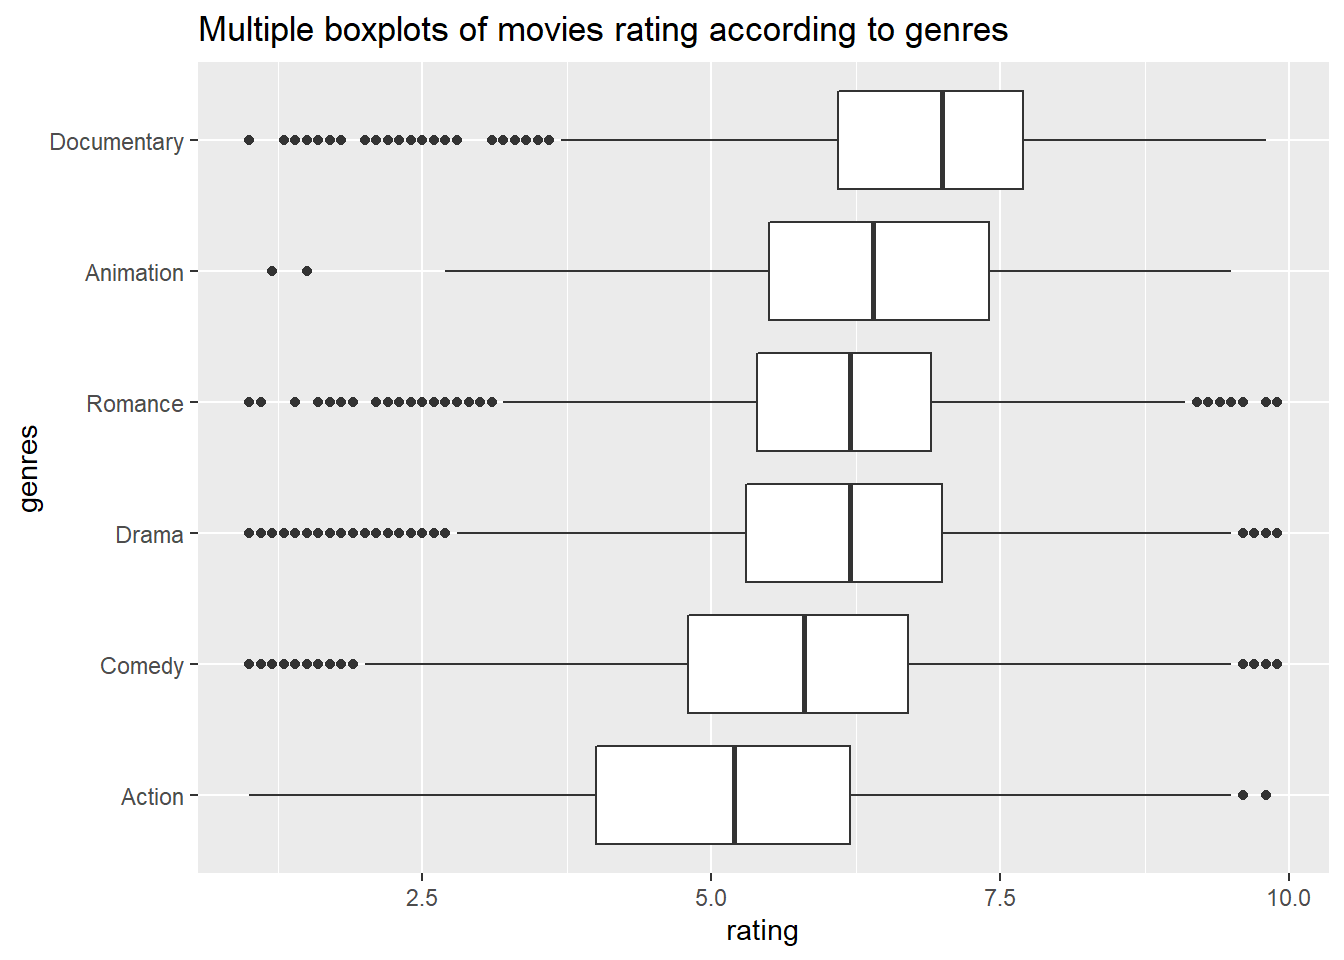
Finally, without consider release year and length, the same conclusion can be drawn from the boxplots of all data.
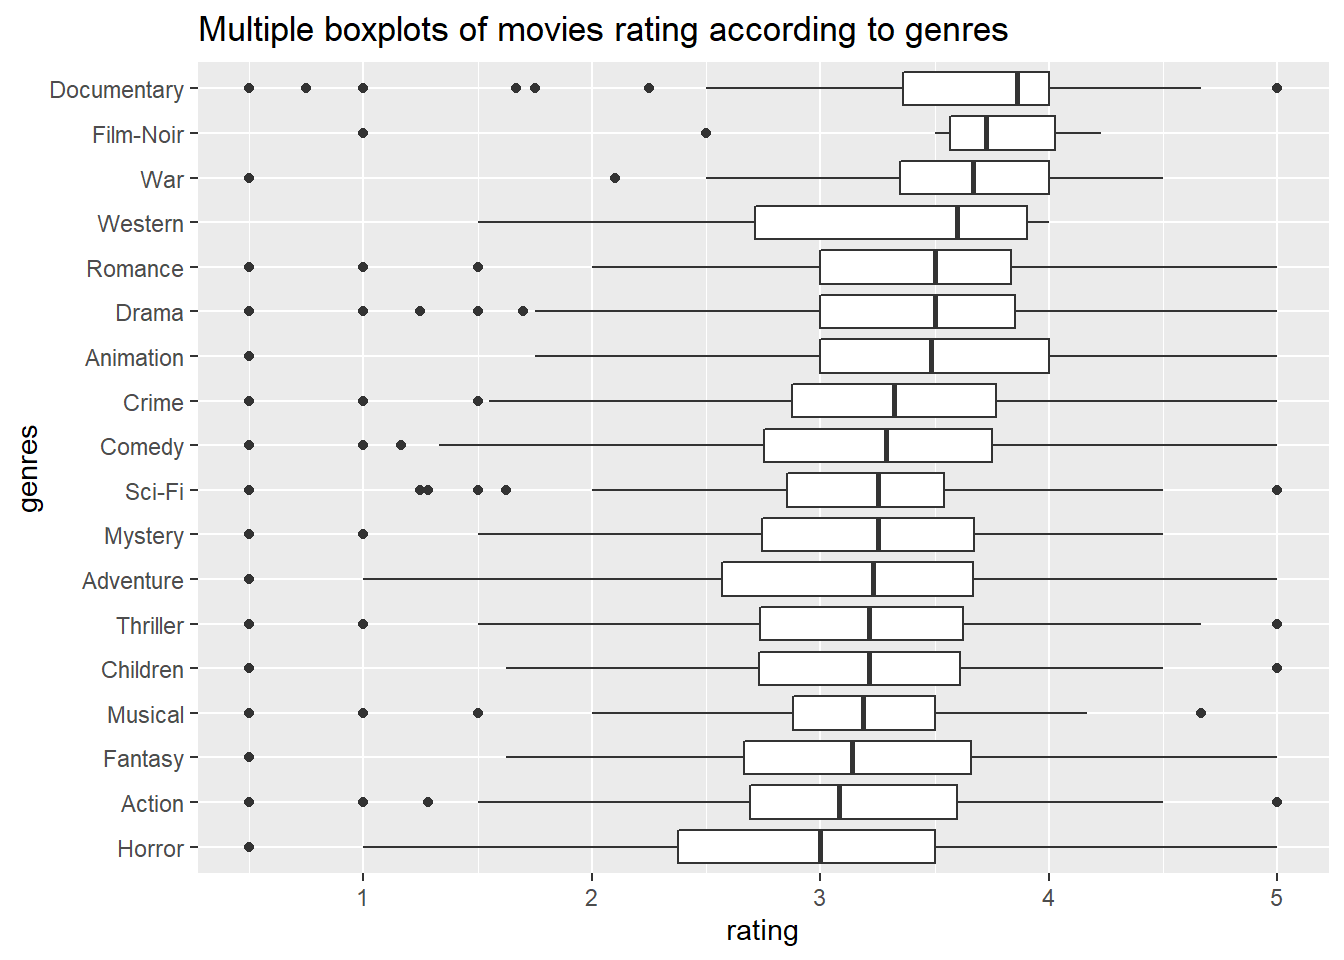
To have a more objective and accurate conclusion, we look at the second dataset to see whether there is any different result we would get by the rating and genres.
Note: this data uses a 5-star rating instead of 10, so 5/5 is the best rating.
We make boxplots by genres and order by their median in decreasing order from top to bottom. For each genre, the corresponding boxplot gives the distribution of ratings for all movies of this movie genre. We can see that the top three movies with highest median rating are Documentary, Film-Noir, and War. And the lowest three are Horror, Action, and Fantasy. We also observe that the top three movies are all have higher first-quantile and third-quantile values, which means that their overall ratings are generally high.
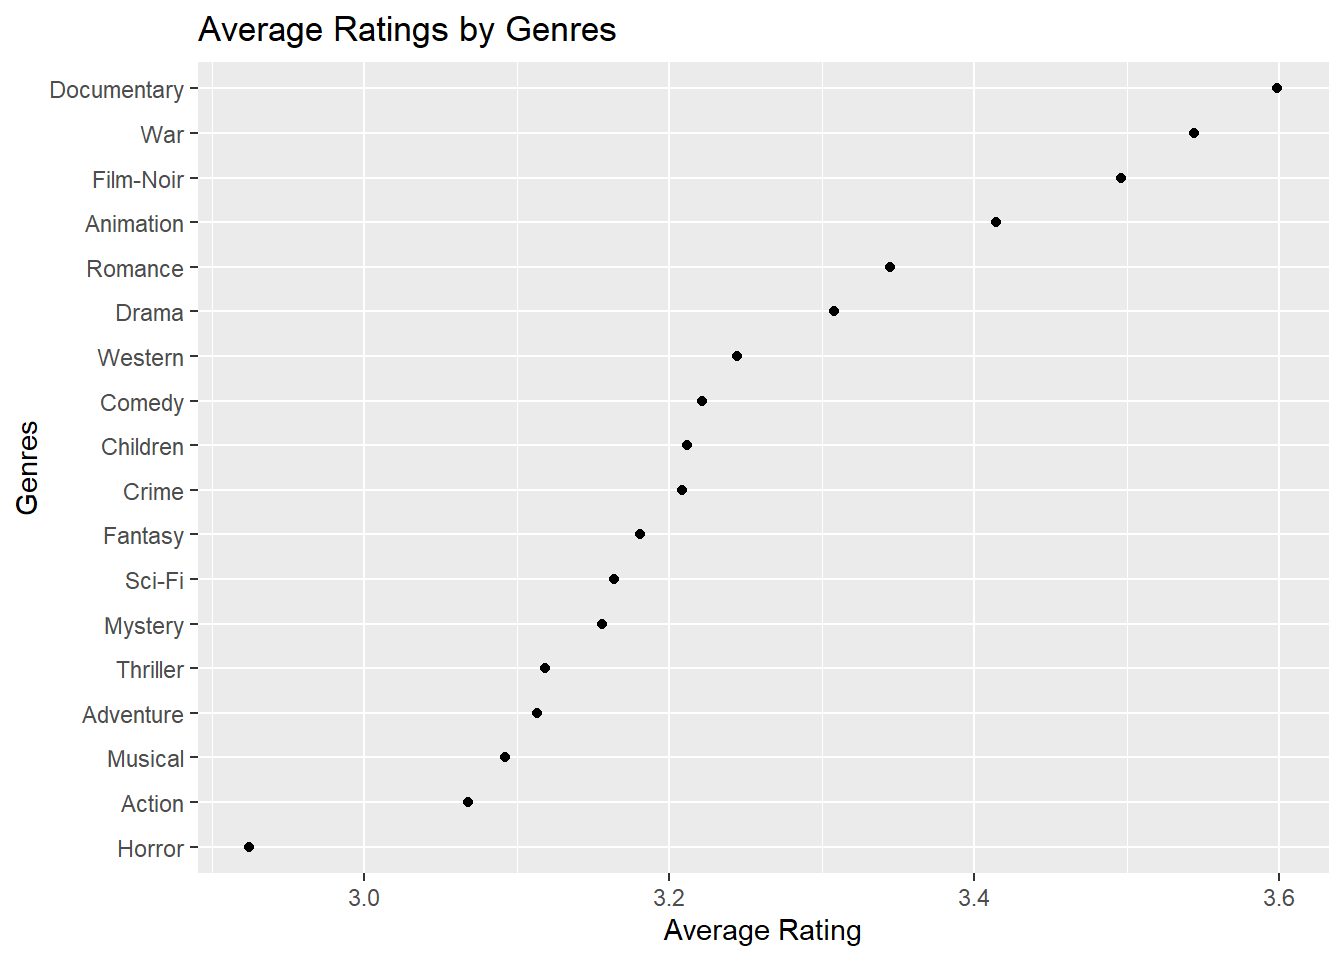
Then, for each genre, we calculate the average ratings for all movies of this genre and give the Cleveland Dot Plot. From the Cleveland Dot Plot, the average rating of each genre are clustered between 2.9 and 3.6. We observed that the top four highest-rated genres are Documenary, War, Film-Noir, and Animation. And the three lowest-rated genres are Musical, Action, and Horror.
The result from this dataset is almost same as the findings from IMDb Datasets, the documentary movies can usually get a higher score, which we have an average on 3.6 here. On the other hand, the action movies (average rating around 3.0) get lower rating more easier.